25 Secrets of the Browser Developer Tools
By Andi Smith - Thursday, November 10 2011
Please note: This post has been archived and may contain information that is no longer accurate or relevant to the subject matter discussed.
Over the last few years there has been one tool that has helped out every web developer more than any other – the browser developer tools. Working in harmony with the web browser, the developer tools allows us to manipulate DOM elements, CSS styles, JavaScript and other useful information from the same window often in real time.
Historically developers have used Firefox’s Firebug add-on to develop and debug their websites, but more recently each browser has developed its own set of tools and each comes with its own advantages and disadvantages. Nowadays it seems hard to imagine ever building a website without one of these handy tools, which are normally accessible by either pressing “F12″ in Windows or “Cmd” ⌘, “Option” ⌥ and “I” on the Mac, or by right clicking on the page and selecting “Inspect Element”.
| Browser | Development Toolset | Type | Documentation |
|---|---|---|---|
| Chrome | Developer Tools | Integrated | Documentation |
| Firefox | Firebug | Add-on | Documentation |
| Internet Explorer | Developer Toolbar | Integrated | Documentation |
| Opera | Dragonfly | Integrated | Documentation |
| Safari | Developer Tools | Integrated (Default off) | Overview |
But are you using the developer tools to their full potential? The biggest positive about the developer tools is that they are incredibly easy to use, but as a result developers often miss out on a large proportion of the functionality provided. Inspired by a video talk by Paul Irish and Pavel Feldman, I’ve compiled a list of “secrets” of the developer console. I’m not expecting every one of these to be unknown to you, but hopefully some of these will help you to become an even better web developer.
If you have any more secrets, feel free to leave a comment at the end of the article and I’ll update the post once I have verified them. I’d also love to know what developer console you use as your primary development tool, let me know below!
The “Console” Tab
The heart of any developer tool is the “console” tab where you can output debug and execute commands in to the current web page.
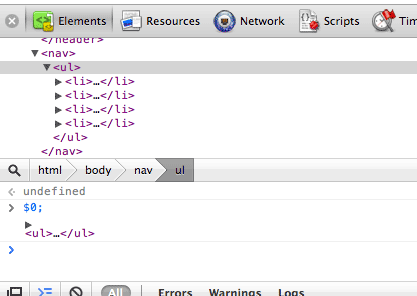
Referencing the current element
Chrome, Firefox, Opera, Safari - If you have an element currently selected in your “Elements” tab, you can use the reference $0 to call it within your code. For example, to see the elements’ contents you would type $0.innerHTML. In Chrome and Safari, you can call the console from any of the other tabs by pressing “Escape” so you don’t have to keep switching. In Firebug, the console is available through an icon to the left of the tabs or by pressing either Ctrl, Shift and L on Windows or Cmd ⌘, Shift and L on Mac.
In Opera, you can select the previous element you had highlighted using $1. In Chrome and Safari, you can select the previous elements you have highlighted using $1 - $4.
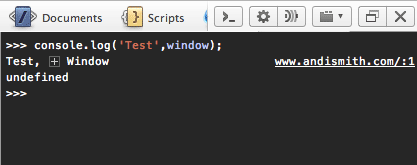
Using console.log to output multiple values and objects at the same time
All - We know console.log() is incredibly useful for outputting debug to the developer console, and preferred over alerts, but it can be irritating to output a string followed by an object if you’re not aware of this feature of logging. Using console.log('message:' + $('#message')) will only tell you that your message is an object, and logging the object by its self can get confusing if the log is happening in the middle of a loop.
console.log() actually accepts multiple parameters, so you can output both
the string and the object from the same command using console.log('message:',
$('#message')); or any other combination of JavaScript type you can think of.
You can use console.warn() for warning messages; console.error() for error
messaging and console.info() for information messages. You can also use
console.assert() to test expressions for true or false.
(Thanks to Masklinn for additional information)
Re-using a JavaScript command
All - If you’ve typed a command in to the JavaScript console and you wish to re-run it, simply hit the up key to scroll through a list of previous commands you have called from the console.
Persist
Chrome, Firefox - There’s an obvious button for persisting console content in Firefox right above the console, but it’s slightly more hidden in Chrome. Right click in the console to reveal a menu with “Preserve Log upon Navigation” as an option.
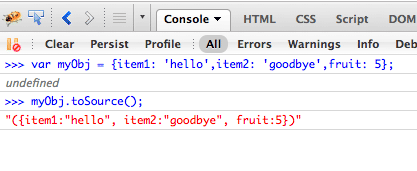
Viewing the source of an object
Firefox - Firefox supports the toSource() method which means it’s available in Firebug for printing out the contents of an object as a string in to the console.
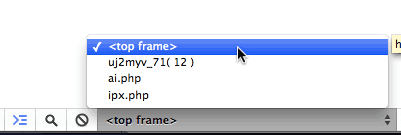
Changing frame
Firefox - Running JavaScript commands from the console command line is incredibly useful, but if you have an iframe to contend with it quickly becomes a problem. Luckily you can use the following command to focus on the frame in question and execute your commands against.
cd(window.frames['frameName']);
Chrome - Chrome allows you to change frame in a different way. On a page which contains frames, you’ll need to go to the “Console” tab and choose your frame from the dropdown at the bottom of the console.
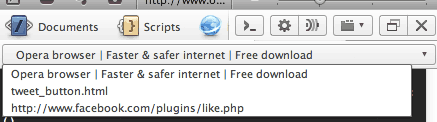
Opera - Opera also has a dropdown for changing frame which is available from the “Console” and “Documents” tab. The dropdown will only appear on the “Console” tab if there are frames to select.
(Thanks to Paul Irish and Daniel Herzog for the additional information)
Copying your code straight to the clipboard
Chrome, Firefox, Safari - Using the copy() command within the developer tools console, you can copy the contents of a command straight to the clipboard.
Making calculations in the browser
All - This tip makes a lot of sense, but it’s surprising how many people don’t use it! If you need to know the answer to a math calculation quickly (e.g. the width of three columns in a 456px container) you don’t need to open Calculator. Just type the math question in to the developer tools’ console and it will return your answer. It’s 152, by the way.
The “Scripts” Tab
Home to all the JavaScript running on the page, the script(s) tab contains a dropdown to allow you to select the script you wish to debug.
Dealing with minified JavaScript
Chrome, Internet Explorer, Safari - Placing breakpoints on JavaScript makes debugging much easier, but if your code has already made it to production then it’s probably been minified. How can you debug minified code? Helpfully, some of the browsers have an option to un-minify your JavaScript.
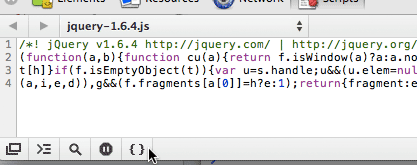
In Chrome and Safari, simply select the ‘Scripts’ tab, find the relevant file in the drop down menu and then press the “{ }” (pretty print) icon located in the bottom panel.
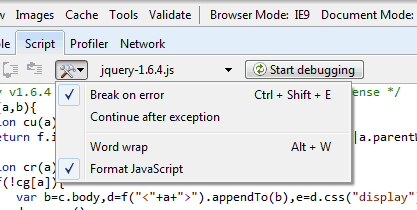
In Internet Explorer 9, click the tool icon by the script selection drop down to find the option to format the JavaScript.
Watching variables
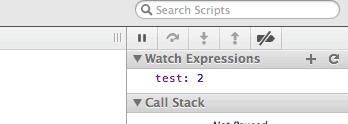
All - A common tool with .NET development, ‘watch’ allows you to monitor a list of variables from one handy area, at the top of the right hand bar on the “scripts” tab. Watching a variable is really easy, just type in the name of the variable and ‘watch’ will keep its value up to date.
Editing and executing JavaScript on the fly
Chrome - Rather than editing in a separate editor and reloading the page, with Chrome you can edit directly in to the page. Simply double click where you would like to change the code, and type! Hit Ctrl/Cmd and S to save.
Creating a breakpoint whenever a JavaScript error occurs
All - Simply click the pause icon in the Script tab of your developer console to pause the script when the first JavaScript error occurs. The line that has caused the error will be highlighted for you to review.
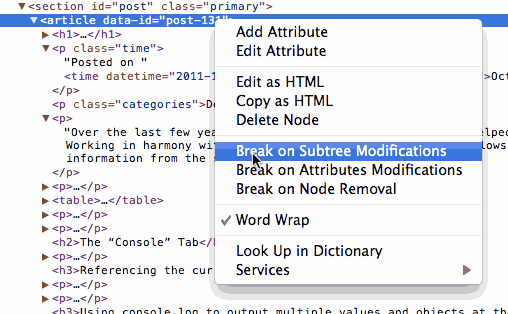
Creating a script breakpoint based on the DOM changing
Chrome, Firefox - If you know your page is breaking when a certain part of the DOM changes, or you just want to find out what script is responsible for changing that element’s attribute, Chrome and Firebug both allow you to set up a JavaScript breakpoint effectively allowing you to find the culprit in your code. Simply highlight the element you want to monitor and right click to select the conditions to break on.
(Thanks to Jason Wilson for the additional information)
The “Elements” tab
Known as the “HTML” tab in Firefox and the “Documents” tab in Opera, the “elements” tab displays the DOM in its current state. On Internet Explorer, you will need to hit the ‘refresh’ button to see the current DOM.
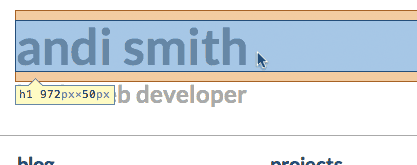
Getting the dimensions of a container the easy way
Chrome, Safari - I’m a big fan of using overflow:auto to contain floated elements, but it causes problems in older versions of Internet Explorer unless you specify an actual width (auto and 100% won’t suffice). The dimensions can be found in the “Computed Style” which is handy but still a number of clicks. Using Chrome or Safari, you can easily view the dimensions of an element by hovering over it in the source code in the “Elements” tab, or alternatively using the magnifying glass in the bottom toolbar.
Firebug, Internet Explorer, Opera - You’ll need to select the “Layout” tab in the right hand panel or scroll through the list of computed styles in the right hand sidebar.
(Thanks to Masklinn for the additional information)
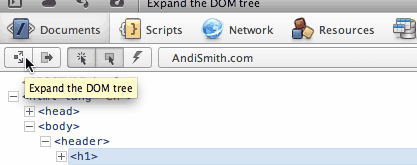
Expand view of all elements
Firefox, Opera - In Firebug, on the “HTML” tab pressing asterisk (*) on the num keypad expands all elements except scripts and stylesheets. Holding shift and pressing asterisk will also expand the scripts and stylesheet (link) elements.
In Dragonfly on Opera, there’s a button in the “Documents” tab to do the same task, as shown below.
Incrementing margin, padding, width, height, border - even color
All - If you have an element which you need to modify the margin, padding, width or height for, you can use the cursor keys to increment/decrement the size.
- Simply use the up and down cursor keys to increment/decrement by a unit of 1.
- In Chrome, Firebug and Safari you can increment/decrement by a unit of 10 by holding the “Shift” key whilst pressing the up and down cursor keys.
- In Chrome and Safari, you can increment/decrement by a unit of 0.1 hold the “Alt” key whilst pressing the up and down cursor keys.
- In Chrome and Safari, you can also increment/decrement by a unit of 100 by holding down the “Shift” key whilst pressing Page-Up and Page-Down.
These shortcuts are especially helpful when you are unsure of exactly what the correct size should be. In Chrome, Safari and Opera you can also use the up and down keys to increment and decrement color values.
(Thanks to mikkelrom for the additional information)
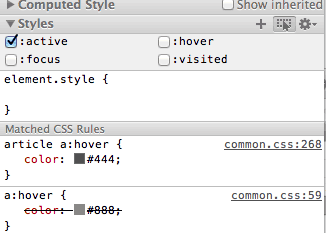
Styling :active, :hover, :focus, :visited states
Chrome, Firefox, Opera - Styling CSS in the developer console is awesome, but becomes a little more tricky when testing other element states such as hover. Thankfully, there is a solution.
Chrome has a button built for this purpose. In the “Elements” tab’s right hand column look for the dotted element/cursor icon which allows you to try other states.
For Firebug, in the right hand column click the arrow menu beside the Style tab and selected your desired state.
In Opera, it’s the icon that looks like a list under “Styles”.
Rotate through color definition types
Chrome, Safari - Colors can be defined in multiple ways on a web page - by name, through a hexadecimal value (3 or 6 digits), as rgb or hsl (or their alpha transparent versions). You can rotate through these different definitions in Chrome or Safari by clicking the color square next to your color.
(Thanks to Masklinn for the additional information.)
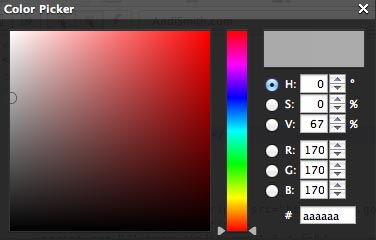
Color picker
Opera - In Opera, clicking the color square next to a color allows you to select a different color via a handy picker.
The “Resources” tab
The resources tab lists all the stylesheets, JavaScript, images used on your page. This tab unfortunately doesn’t exist in Firebug or Internet Explorer, although some of its features are integrated in to other tabs.
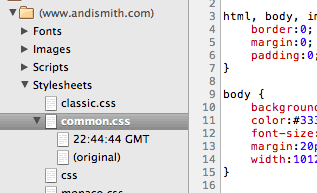
Saving your changes
Chrome, Internet Explorer, Safari - Making changes to the CSS or JavaScript is great, but it becomes a hassle to re-implement in to your source code once you are happy.
In Internet Explorer, on each tab a “save” icon provides save to file functionality on a per file basis.
Meanwhile the “Resources” tab in Chrome and Safari has a handy feature that stores all your changes as specific revisions enabling you to quickly go back and forth through all your changes. Find the file where you’ve applied the changes (which can be easily accessed by clicking the file name next to the element you’ve changed), and a list of revisions will be provided. In Chrome, right click on the filename to save a new version of your file. In Safari you’ll unfortunately have to copy and paste.
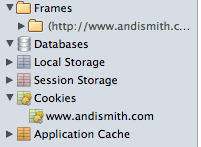
Cookies and Storage
Chrome, Opera, Safari - Also in the list of resources is a easily accessible list of different storage options together with any data stored for each option. Opera has a “Storage” tab which does the same thing.
The “Network” tab
The network tab shows all the resources and files downloaded to load your page. In most cases the developer tools need to be open for the network tab to show any information, so you may need to refresh. The tab is known as “Net” in Firefox. For Internet Explorer, it is only available in version 9 and later.
Disabling browser cache
All - Each supported browser allows you to disable cache, but there is no consistency with how.
In Chrome, you’ll find the option in the settings cog. In Firebug, you’ll find the option in the arrow alongside the “Net” tab header. In Internet Explorer, the option is under “Cache” in the menu bar.
In Opera, to clear the cache click the Network tab, select the Network Options secondary tab and choose the first option. In Safari, you can disable your browser cache under the Develop menu in the menu bar.
To bring up the clear cache (and other data) dialog on any browser in Windows press Ctrl, Shift and Delete.
(Thanks to Steven and karl for the additional information)
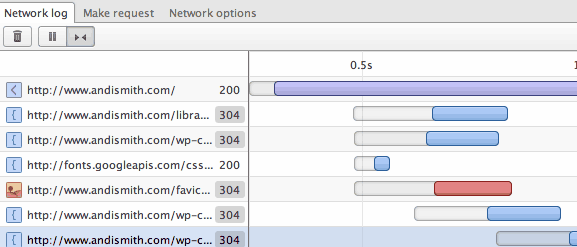
Latency
All - In Chrome and Safari, the network tab allows you to see how long it takes a server to respond to a request. The faded color line for each resource indicates when the request was sent, and when a response was sent back. The filled color indicates when the resource was downloaded. In Chrome, you can hover over these lines to get a breakdown of where the time was spent.
In Opera, the same principles apply except the latency is measured by a grey line as opposed to a faded line.
In Internet Explorer, latency is marked as yellow and hovering over the line will give more information.
In Firebug, latency is marked in the color purple and labelled as ‘Waiting’. Hovering over one of these lines in Firebug also gives a detailed breakdown of where the time was spent.
DOMContentLoaded, load event fired
Chrome, Safari - The network tab for Chrome and Safari also reveals 2 additional pieces of information, DOMContentLoaded as a blue line and load event fired as a red line.
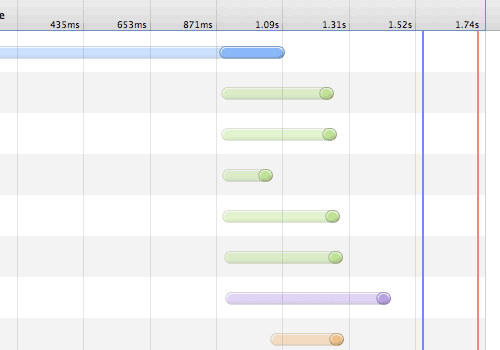
The DOMContentLoaded line indicates when the browser has finished parsing the document (but other resources such as images and stylesheets may not be downloaded), whilst the load event line indicates when these resources are complete.
If the two events fire at the same time, the line will be purple.
(Thanks to Steven and Joey for the additional information)
Other
Crashing
All - Sometimes I find my developer tools have crashed and won’t respond to my mouse clicks. Rather than close the entire browser window and re-open, I often find that using the keyboard shortcuts to close and re-open the developer tools fixes the problem.
I hope these features and secrets have been useful to you, although your skill level and experience will determine how many of these are new to you. I deliberately haven’t included profiling and remote debugging in this list, as these are topics I want to cover in more detail in a later post. Please feel free to leave feedback, corrections and your own tips below!

Andi Smith is a web developer from London, United Kingdom. He likes to build highly performant websites which innovate with genuine value.